
Using Filters to Find What You Need
Filters help you quickly find specific information in your sheets by showing only rows that match your criteria. This is especially helpful when working with large datasets.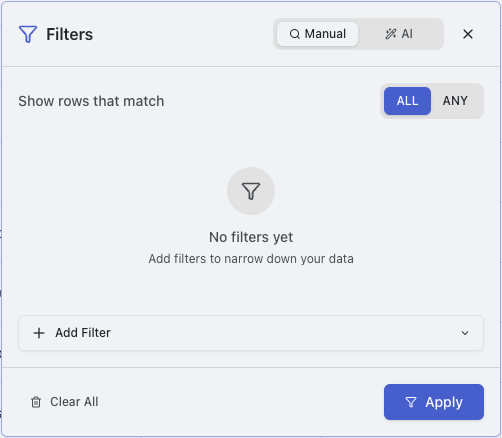
Creating Basic Filters
Add Filter Condition
Configure your filter by selecting:
- Column: Choose which column to filter on
- Operation: Select the comparison operation
- Value: Enter the value to compare against
Create “Group filters” to combine groups of different filters together within a group
AI Natural Language Filtering
Raycaster’s AI assistant can help you create complex filters using natural language queries. Instead of manually configuring multiple filter conditions, simply describe what you’re looking for in plain English.Describe Your Filter
Type your filtering request in natural language. For example:
- “Show me companies in biotech with more than 100 employees”
- “Filter for people who work at startups founded after 2020”
- “Show only companies that have raised funding in the last year”
Natural Language Filter Examples
Here are some examples of effective natural language filter queries:- Industry and Size: “Show technology companies with over 500 employees”
- Location and Funding: “Filter for startups in California that have raised Series A funding”
- Date Ranges: “Show companies founded between 2018 and 2022”
- Multiple Criteria: “Find biotech companies in Boston with female CEOs and over $10M in funding”
- Exclusions: “Show all companies except those in the finance industry”
The AI assistant learns from your data structure and column names to provide more accurate filtering suggestions over time.
Combining Filters
For more complex filtering needs, you can combine multiple filter conditions:Set Condition Relationship
Choose how the conditions relate to each other:
- AND: All conditions must be met (default)
- OR: Any condition can be met
Filter Logic Examples
Example of combining filters with AND logic:- Column “Industry” contains “biotech” AND
- Column “Funding” is greater than “5000000” AND
- Column “Country” equals “United States”
- Column “Industry” contains “biotech” OR
- Column “Industry” contains “pharma” OR
- Column “Industry” contains “medical devices”
Clearing Filters
To remove filters and return to viewing all data:- Click the “Filter” button in the toolbar to open the filter panel
- Click “Clear All” to remove all filters
- Alternatively, click the “X” next to individual filters to remove them selectively
Sorting Data
Sorting helps you organize your data in a meaningful order, making it easier to analyze and understand patterns.Basic Sorting
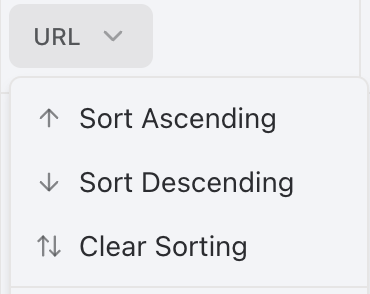
To sort by a single column:Click Column Header
Click directly on the column header you want to sort by
- First click: Sort ascending (A→Z, 1→9)
- Second click: Sort descending (Z→A, 9→1)
- Third click: Remove sorting
Combining Filters and Sorts
Filters and sorts work together to help you pinpoint exactly the data you need:- First apply filters to narrow down to the specific data subset you’re interested in
- Then apply sorting to organize that filtered data in a meaningful way
- Both filters and sorts remain active until you clear them
Example Combined Workflow
A typical workflow might look like:- Filter companies to only show those in the pharmaceutical industry
- Further filter to include only those with funding over $10M
- Sort these filtered companies by employee count (descending)
- Add a secondary sort by founded date (newest first)